
 About me
  History
  Let's learn
  Contact us
  Arduino tutorials
 Circuits tutorials
  Robotics tutorials
 Q&A
Q&A Blog
Blog  Arduino
  Circuits
 Robotics
  Modules
  Gadgets
 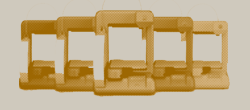 Printers
  Materials
  3D objects
  3D edit
  Donate
  Reviews
  Advertising


Android bluetooth Arduino data receive
2.0 Receive data and create chart
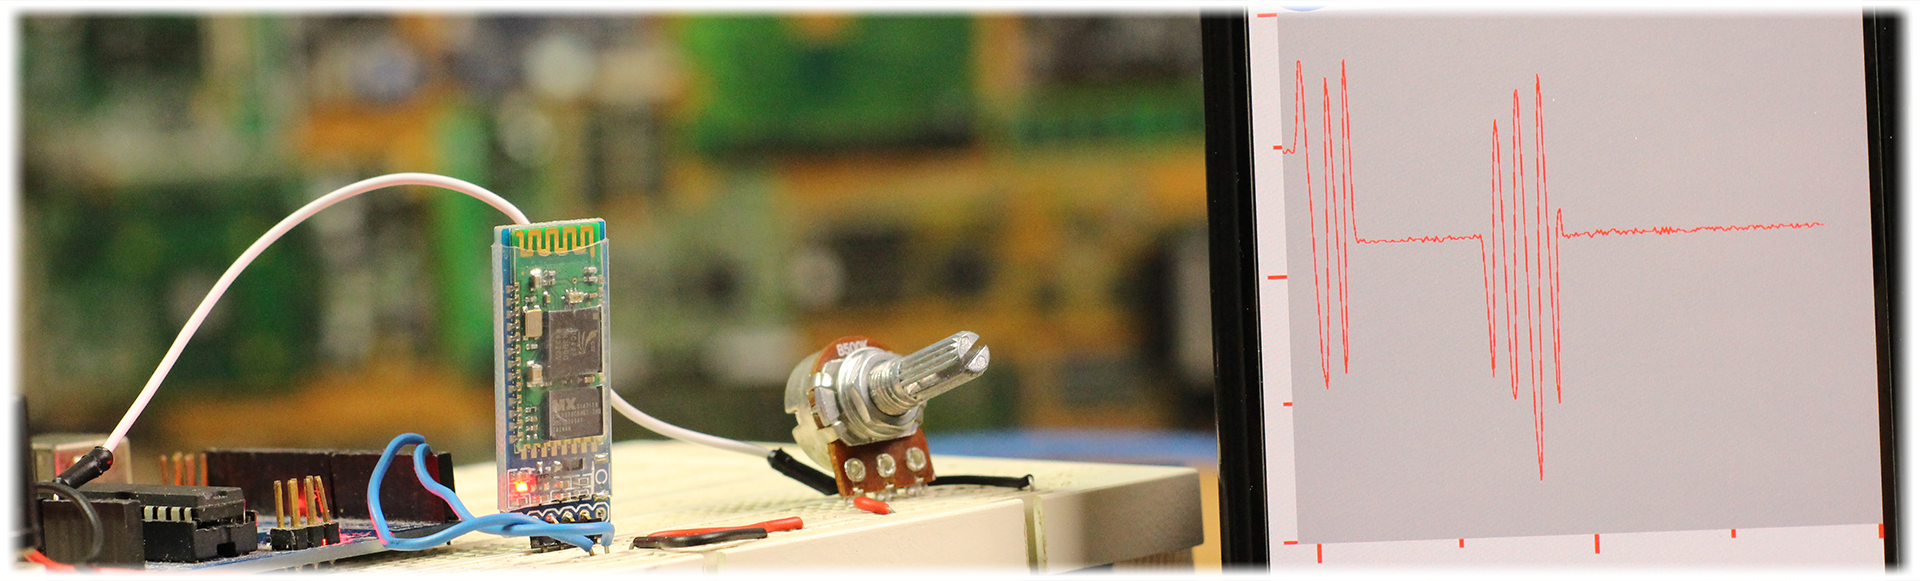
In this part of the tutorial we will read the analog value of a potentiometer between 0 and 5 then send the data using bluetooth connection. We receive the data and create a chart with it. So let's start.
Downlaod this App here
2.1 The schematic
The schematic is the same. In the next photo below you have the schematic that you should mount for this simple part using the Arduino UNO. The potentiometer is connected to 5V and GND and the middle pin to the analog input A0 of the arduino. The Bluetooth module is the HC06 and it has a wart comunication so it will use the Tx and Rx pins.
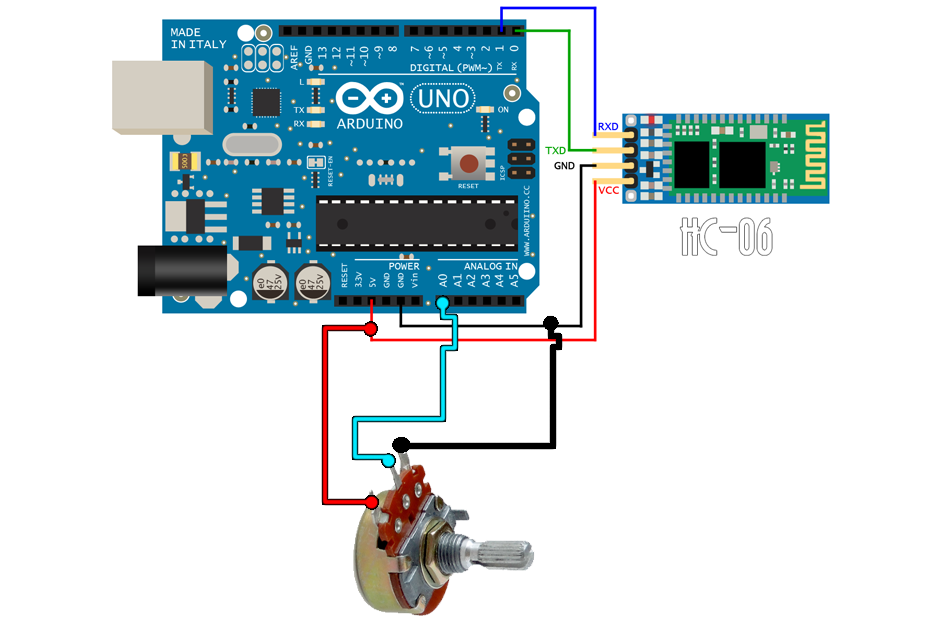
Ok, now we have the schematic that will read the values from the potentiometer. Let's take a look over the code now.
2.2 The code
Ok guys, the first thing to do is to start a serial comunication with a baud rate of 9600 bauds since the HC06 bluetooth modules works at that speed by default.
The ADC of the arduino has 10 bits. So 2 to the 10 will give us 1024 posible points so we will have to map that value to an 8 bits data. There are two ways to send data through the serial port. Using Serial.
/* Electronoobs Bluetooth data receive with
 * Android and Arduino. Small example.
 * Remember to disconnect the Rx and Tx pins of the HC-06 when
 * uploading the code
 *
 * Subscribe: http://www.youtube.com/c/ELECTRONOOBS
 * Tutorial: http://www.electronoobs.com/eng_arduino_tut20_1.php
 */
//Inputs
int in = A0;

void setup() {
  Serial.begin(9600);
  pinMode(in,INPUT);

}

void loop() {
  //Map the value from 10 bits to 8 bits:

  byte val = map(analogRead(in),0,1024.0,0,255);    //Byte = 8 bits = 2 to the 8 = 255
  Serial.write(val);                                //Serial.write will send only one byte at a time
  delay(400);                                        //Small delay between each data send
}
In this case I've used Serial.
2.3 The App
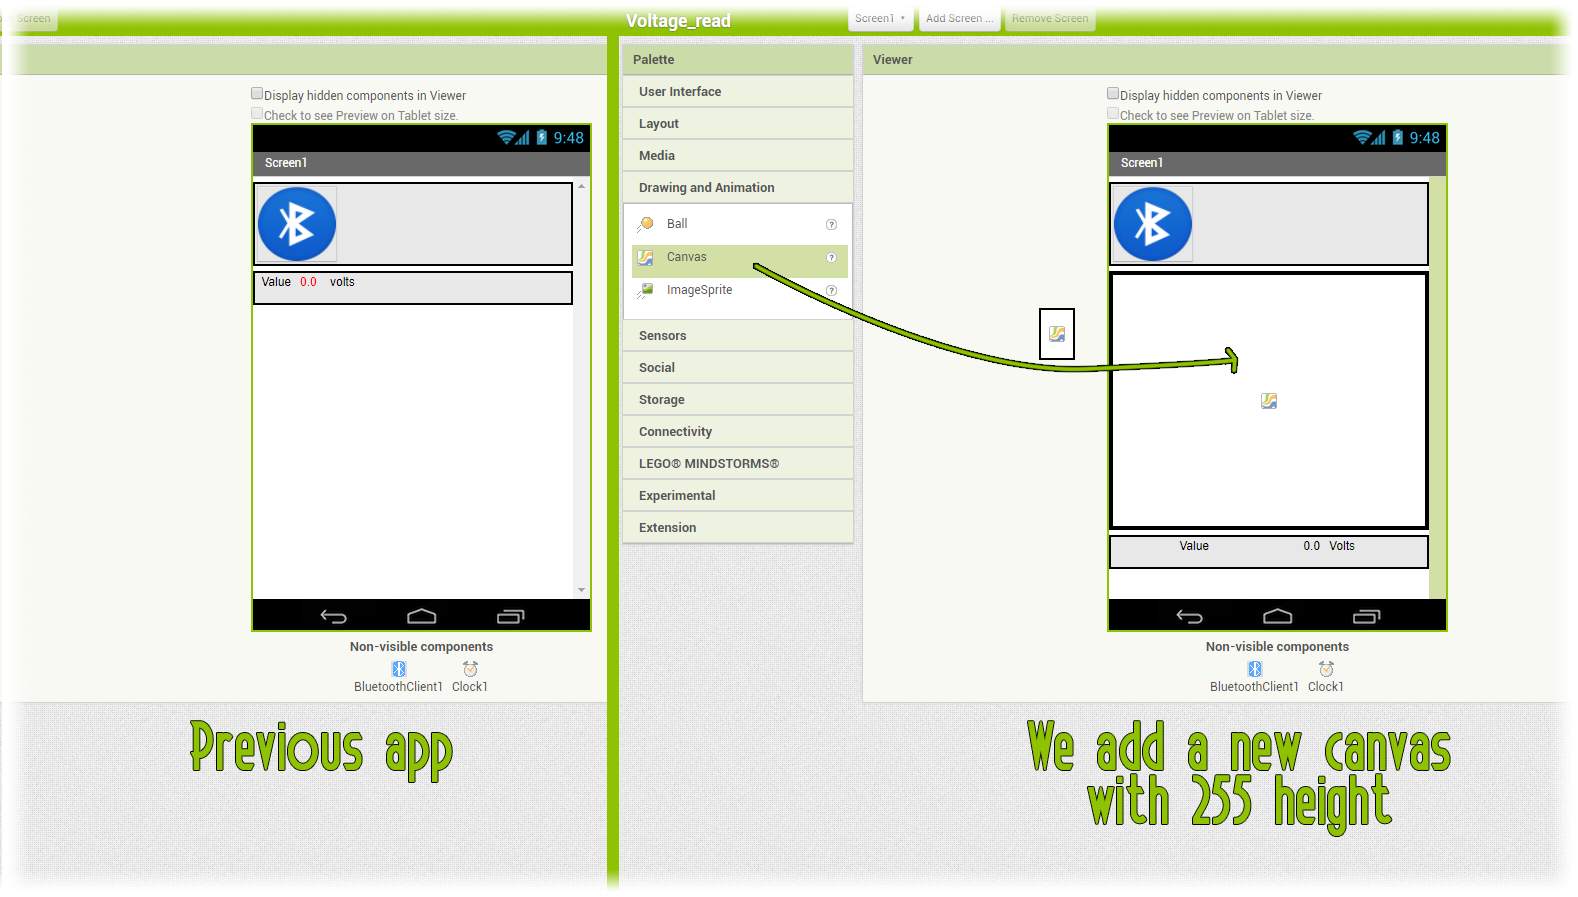
The App is the same as in the previous aprt as you can see below. But now we add a new horiznotal arrangement and inside it we add a new Canvas with a height of 255 pixels. In the code later we will receive one byte number so the maximum value will be 255. Add the canvas as below and now let's jump to the code part of the app.
2.3.2 The App code Blocks
The time and connection code in this case is the same. We connect using the list piker. Once connected we have to mount the code blocks below. As you can see we have initialized 4 variables. Two for the present x and y data and two more for the previous data. In order to graph the receive data we need the difference between the present and previous data to create a line.
So we initialize those variables with a value of 0 in a number format. Inisde the timer loop as you can see we check for Bluetooth connection once again and if yes we check if there is data to receive. If yes we first give the previous value the present value and next we read the new received value.
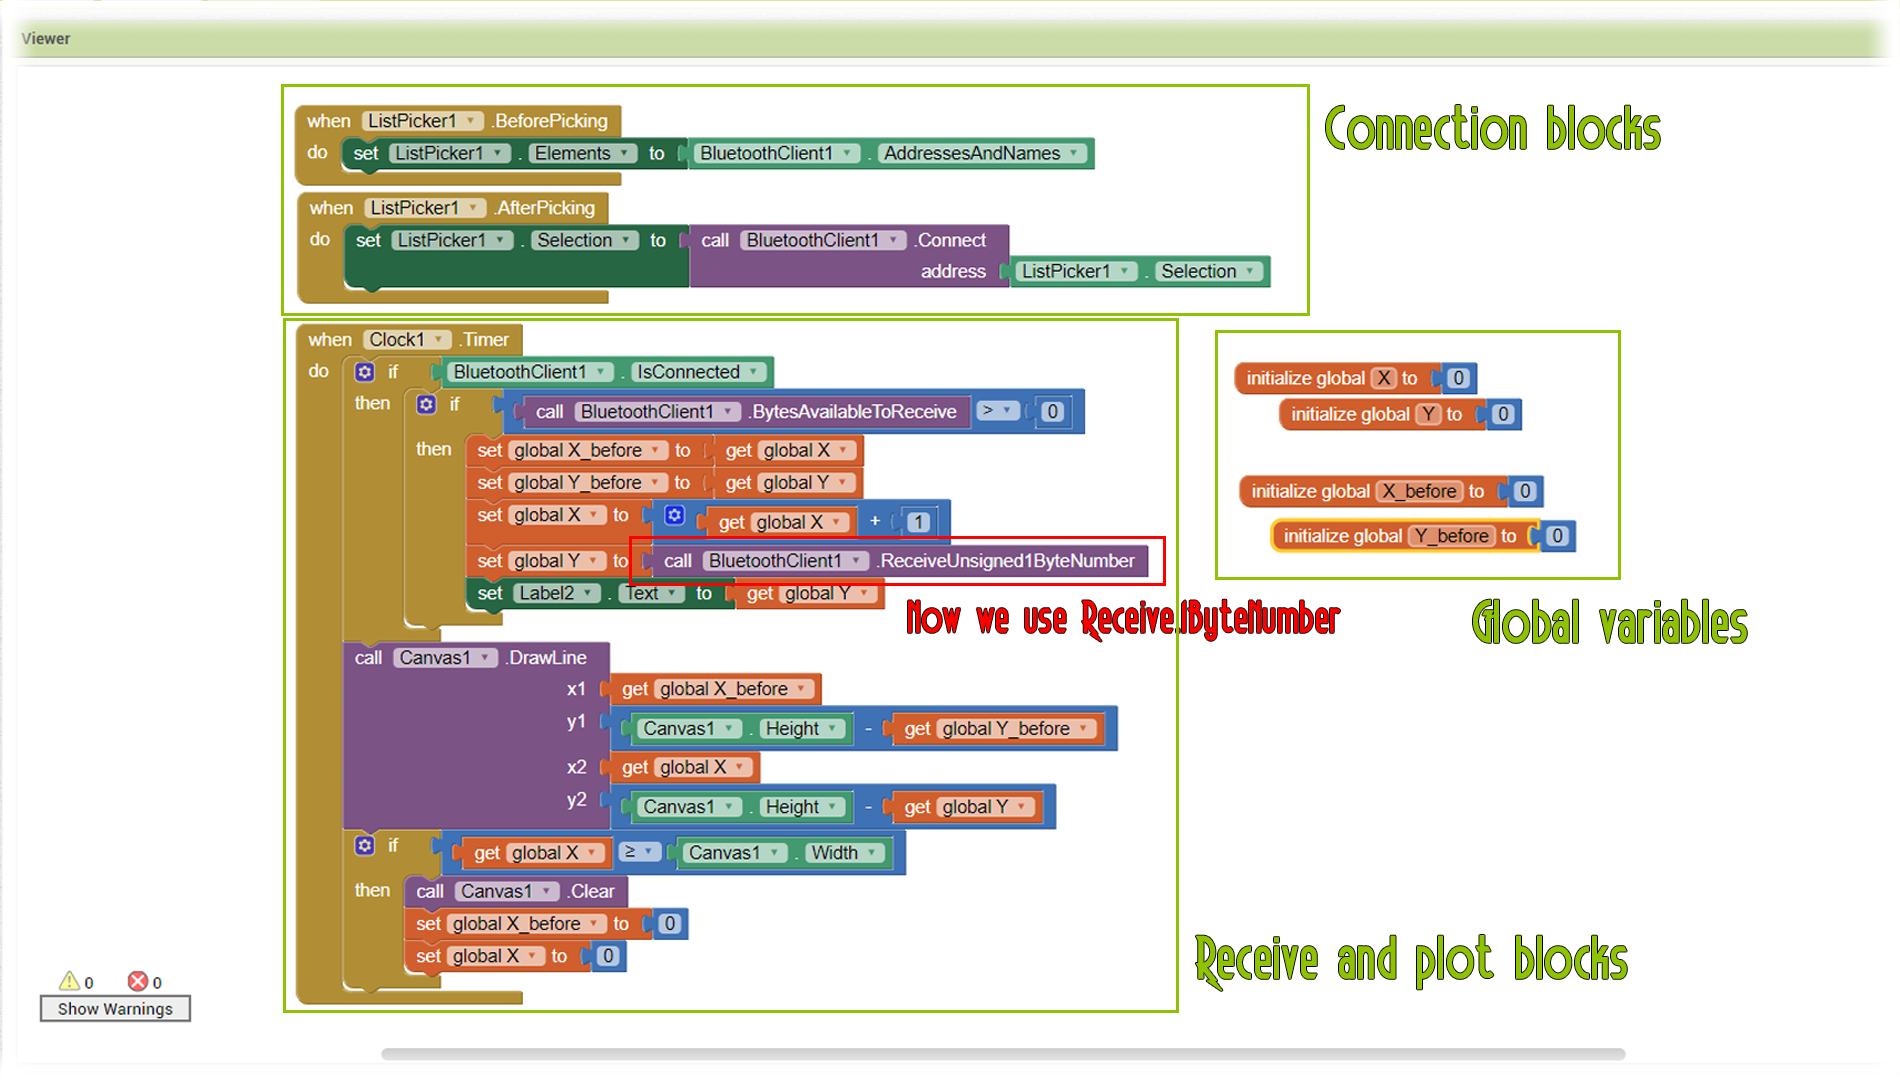
We increase the "X" value each loop so we could plot over the entire graph. Once the "Y" data is saved we create a line between previous and present data using the DrawLine block. In that block the height bust be the total height of the graph minus the received data.
Finally we check if we have reached the maximum width of the graph. If yes, we reseet the Canvas and we start plotting once again from the beginning od the graph and also reset the "X" values to 0.
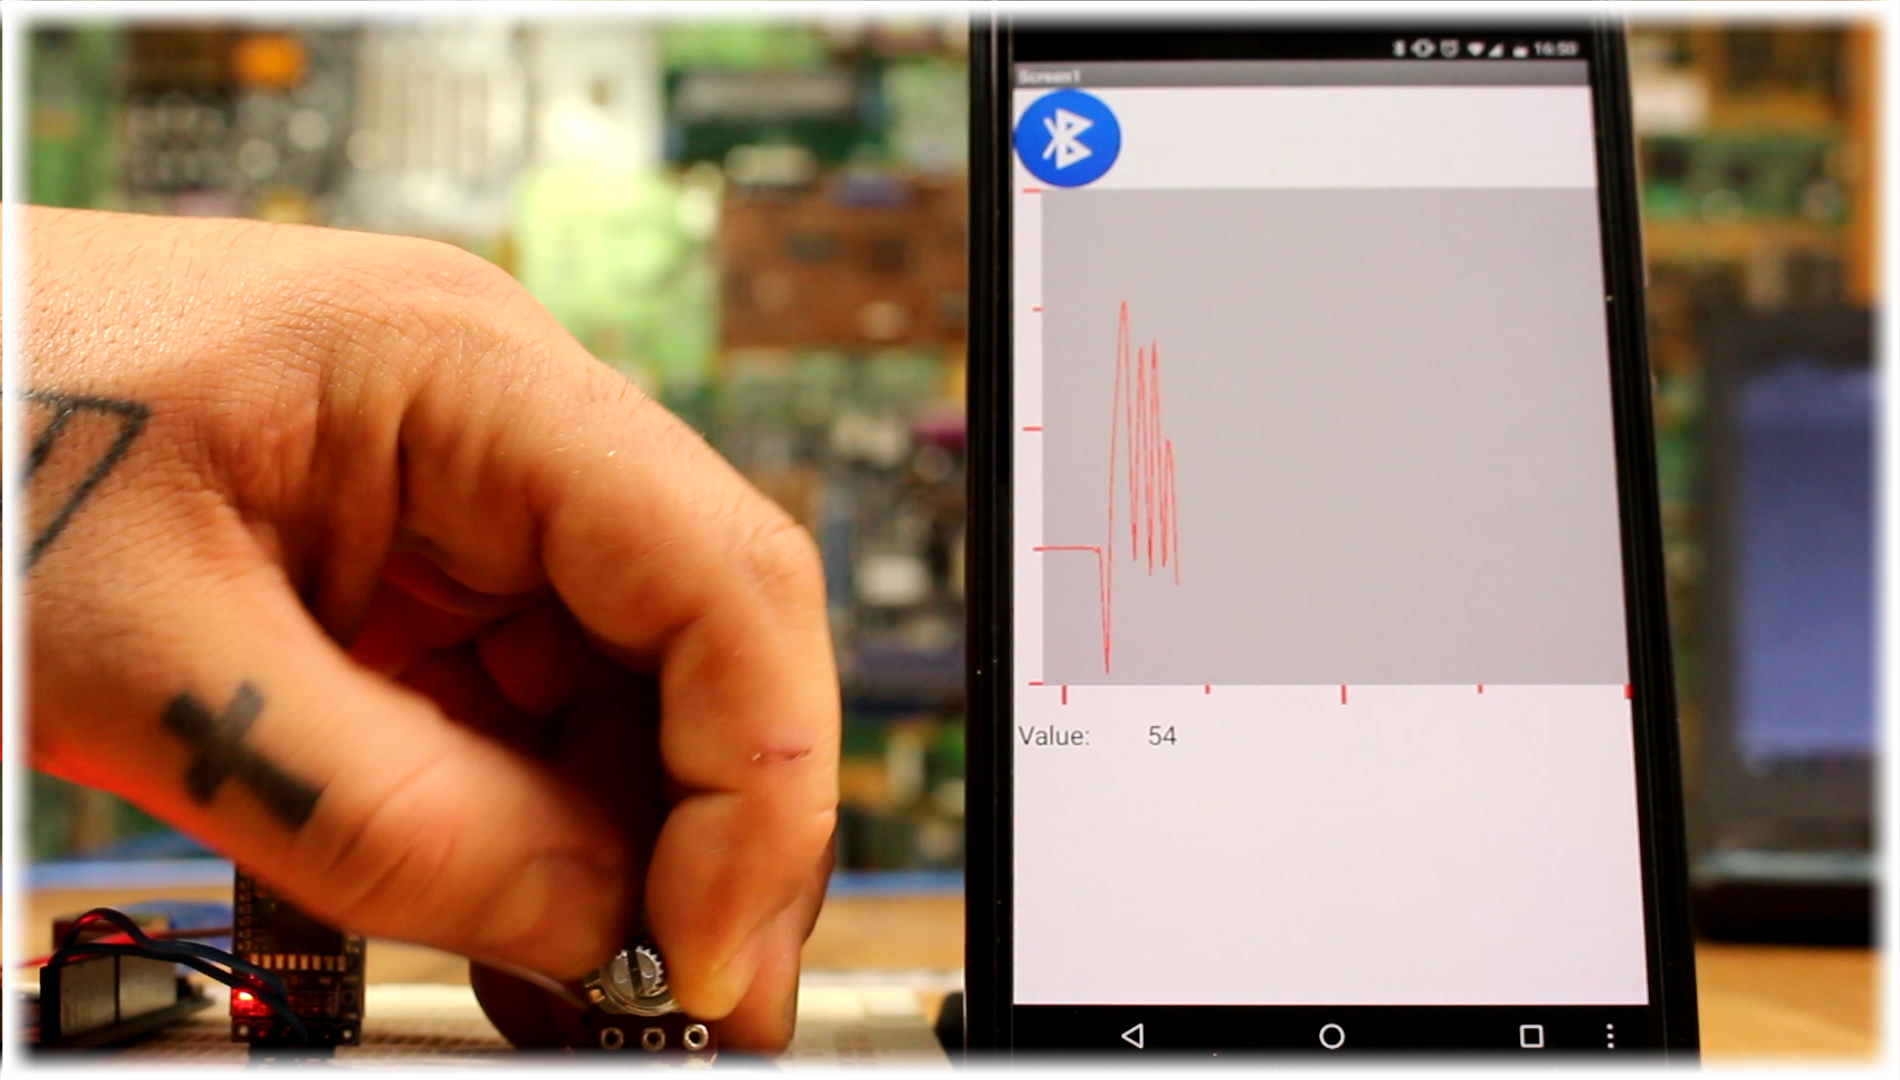
Now save the app, copy it to the smartphone, install it and open the App. Connect to HC06 and as you can see below we receive data with a range from 0 to 255 and we plot that value. Nice rght?
Quite easy right? You could improve the App any way you want. This was just a small example of what you could do and how to use the