We all know that light comes in the form of waves. Each color has a different wavelength. To measure the wavelength we use a so-called spectrometer and today I’ll be doing a homemade one. Basically we make the light pass through a small slit and then we use a diffractor and split the colors of the light, each one with a different angle. We point the light towards a digital camera. We read the values of the camera with the Arduino and graph those values according to the intensity. Like that we get the color spectrum of our light. Today we will learn some physics and try to make this homemade and crude spectrometer. I bet that you will learn something new so let me show you what we need, the entire physics process, the Arduino code for the display and the camera and how to assemble it. So guys, let’s get started.
To understand, we assume a beam of white light traveling through air. White light has all the colors merged together. In front of it we add a material with a different refraction index than the air. Since each color is affected differently, the red color slows down just a bit so the angle changes just a bit as well. The green color slows down even more so the angle is bigger. And the blue one slows down even more, so we get the highest angle difference. So as you can see, just by passing the white light through a different refraction index material, it can split the light into all the colors.
That’s what a so called diffraction grating will do. Mine has 1000 lines per mm. Basically, when light hits this "transparent film", it will split the light into all its colors. As you can see in the video, using white light, we can see the full spectrum from red to blue. So basically, when light hits this film, it will point the red color more to the left, the green light somewhere in the middle and the blue color more to the right. Once we have the color spectrum we have to measure the intensity of the colors. For that I have a digital camera with the TSL1401 chip. I take the lens off and as you can see, we have that linear sensor. We can read the sensor values with the arduino. The camera has 128 pixels and we can get the intensity value of each pixel on the A0 pin and we can measure that with the Arduino analog inputs. All we have to do is to make the color spectrum hit the entire width of the camera sensor. Then we use the Arduino MEGA to read each pixel of the camera and display the values on the TFT display.
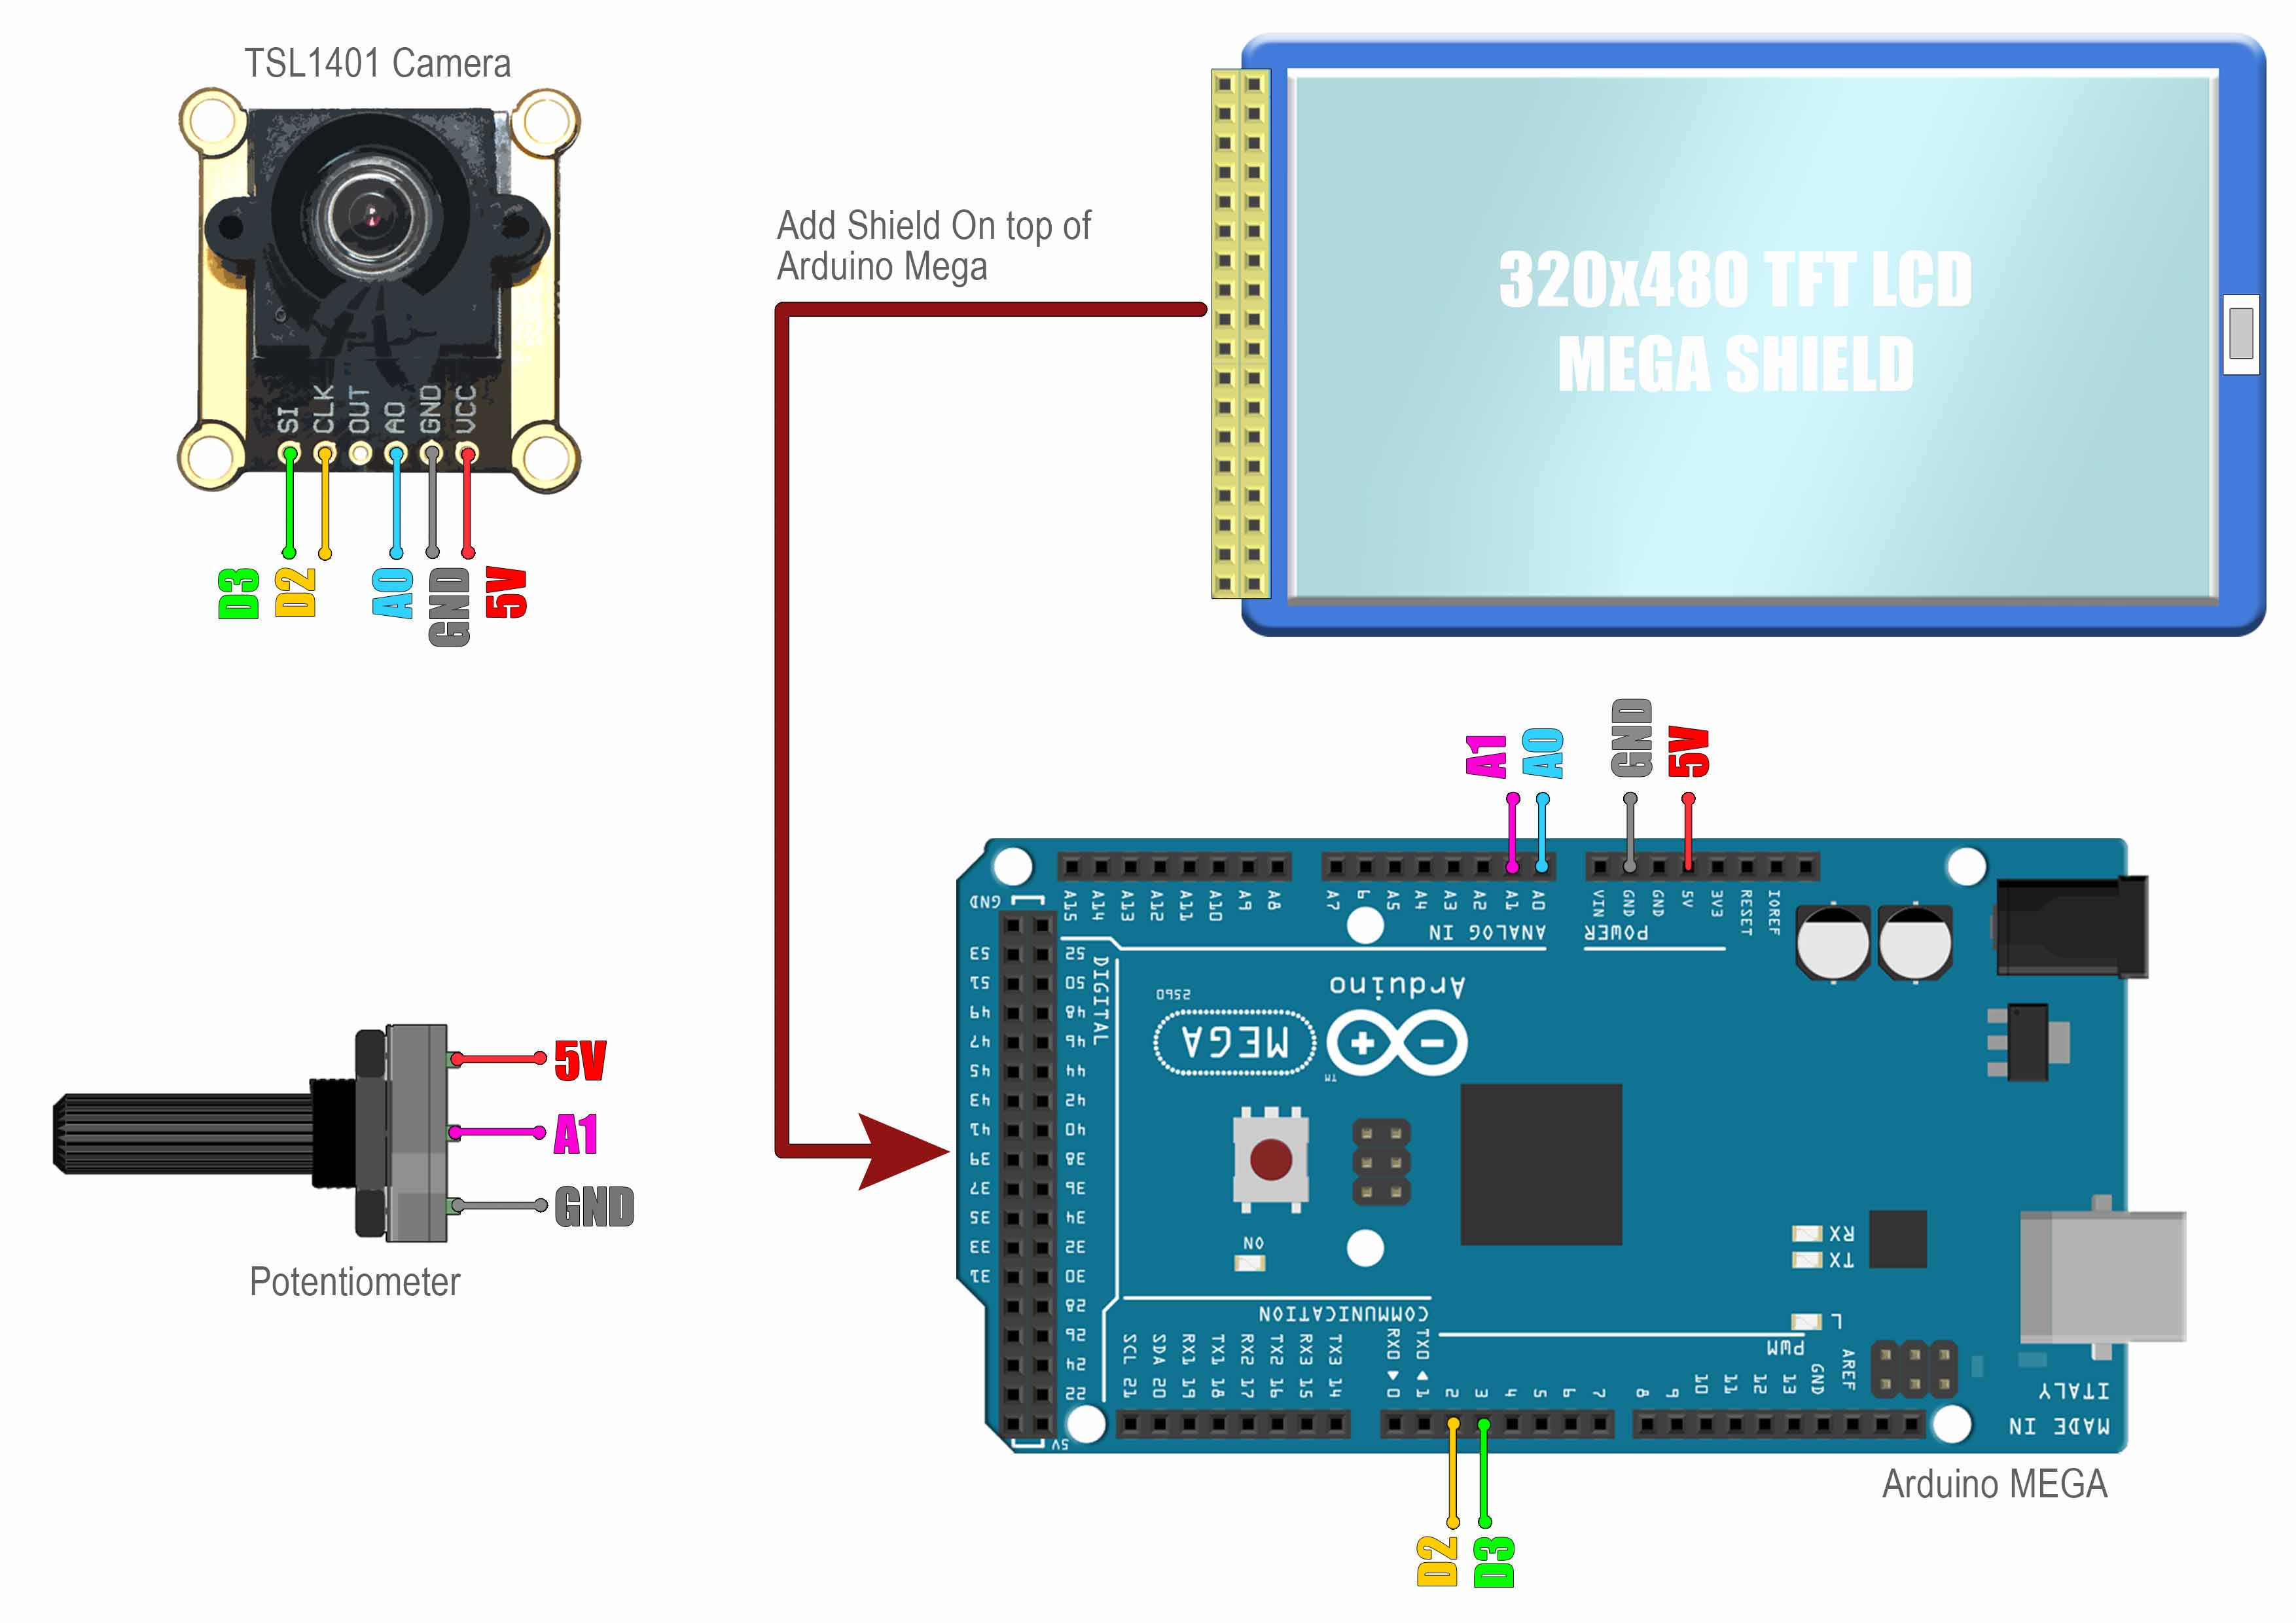
The schematic for this project is something like this below. This project was made by stoppy71 on instructables and I really want to thank him for that. Connect the camera to 5V, ground, clock and data and the A0 pin will be connected to the analog Input A0 of the Arduino MEGA. We are using a MEGA because is compatible with the TFT display. Once the camera is connected, just snap this display on top of the Arduino MEGA.
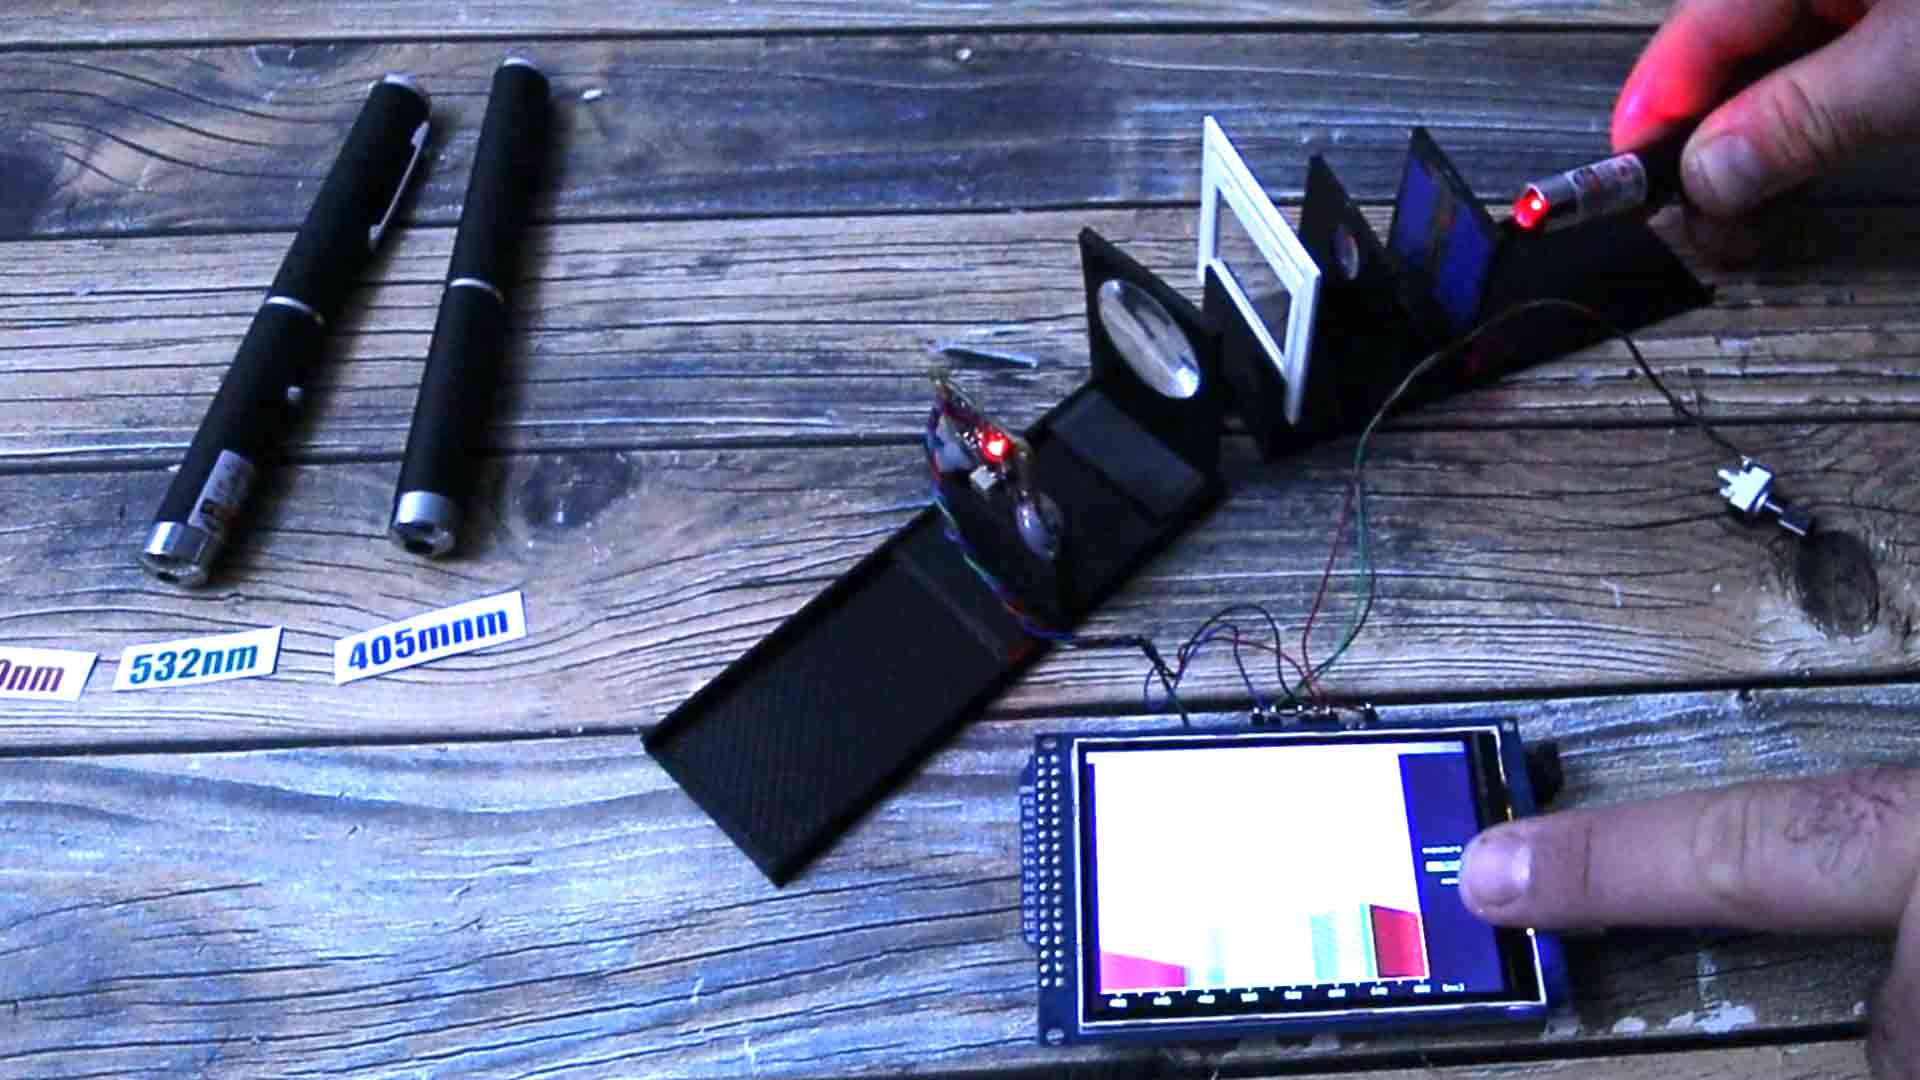
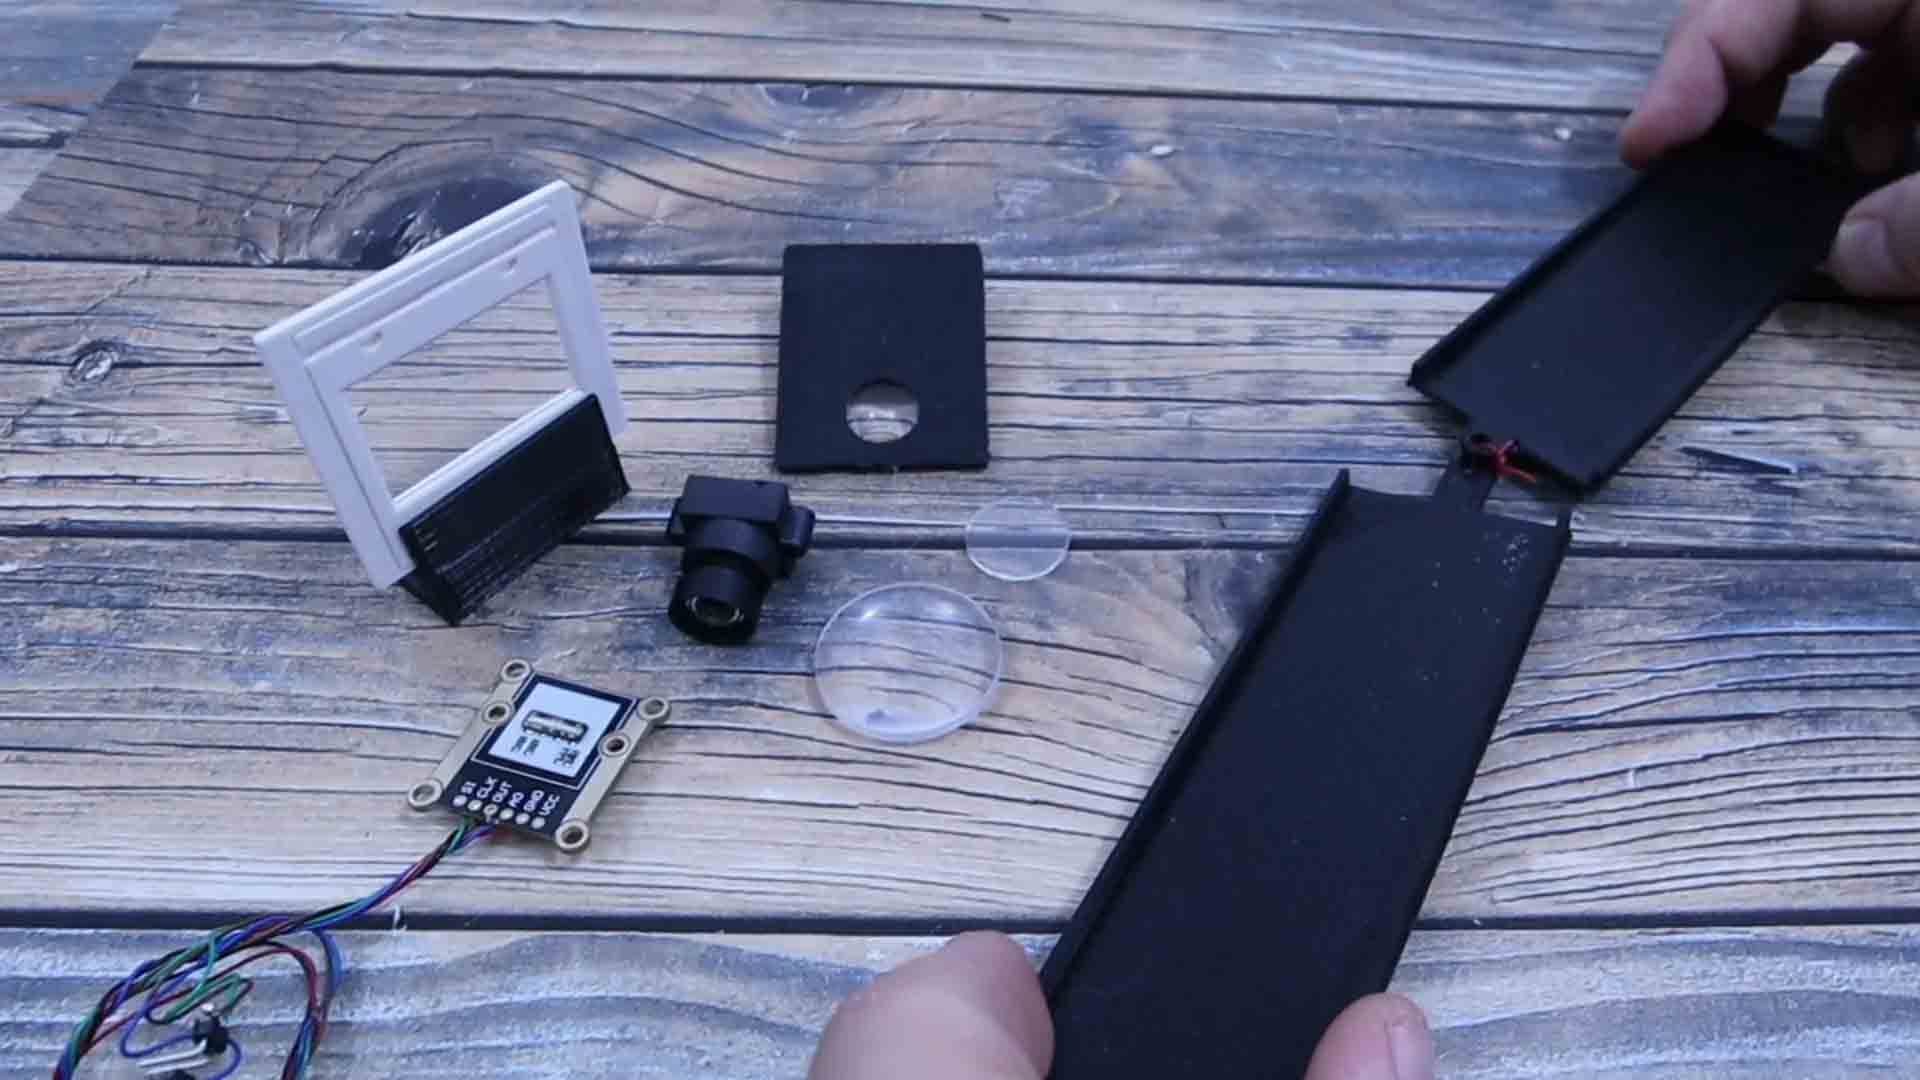
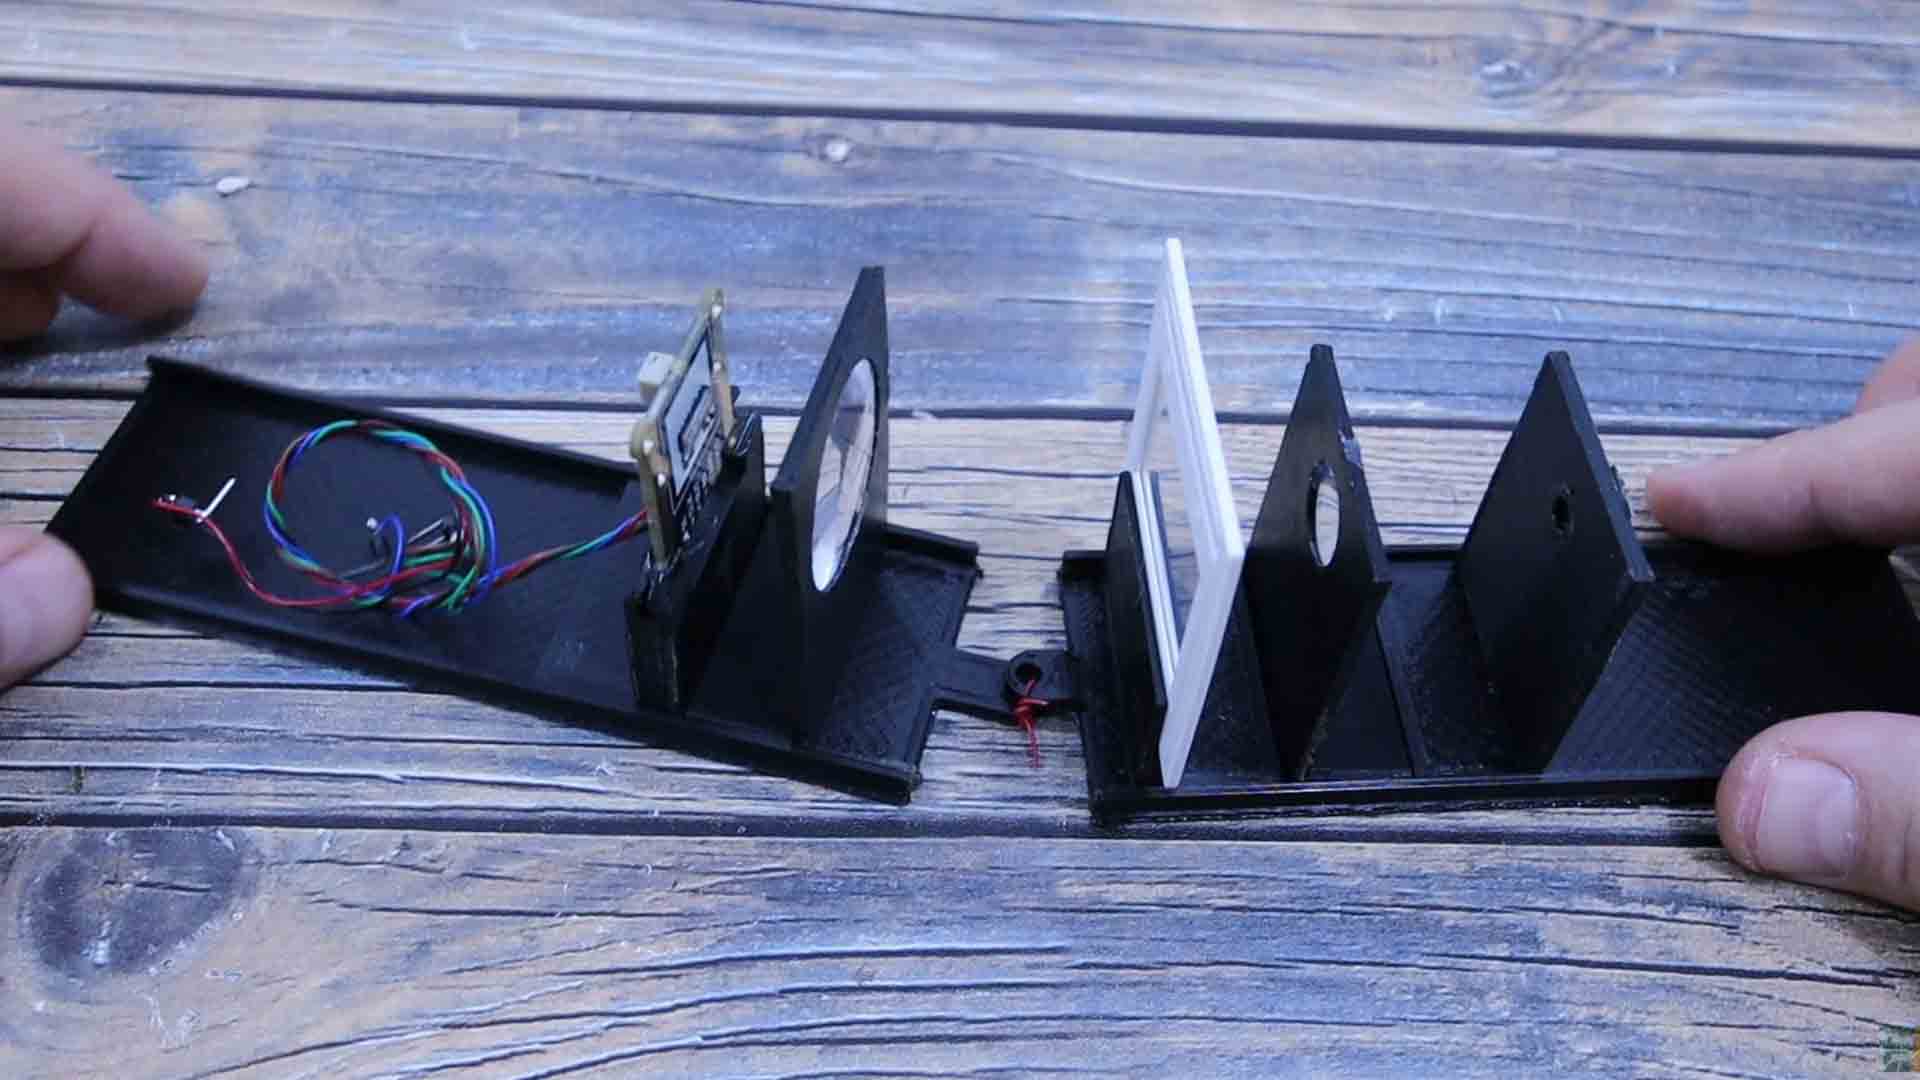
From right to left we first have the razor slit that will only allow stright light to pass and only a small amount. Then we have a lens to focus the light. Then we have the diffraction grating that will split the light into the entire spectrum. On the other 3D slide we add the second lens that will enlarge the spectrum and focus it on the camera. Fianally we add the camera connected to the Arduino MEGA. That's it. Upload the code and test it. You have to play around with the angle and focal distance till you get good results. Calibration is very important.
If you open this code you will see that we first import the library for the display. Download it from the link below as well. Then we define the pins for the camera. In the void loop we first print the graph lines for the X axis. Then we use the “GET CAMERA” function. This function will create a “FOR” loop from 0 to 127 because we read 128 pixels from the camera. After each clock pulse, we read the analog input on A0 and we store the brightness value on this vector on the corresponding position from 0 to 127. Now we have all brightness values stores. In the void loop we create another “FOR” from 0 to 128 and we create a vertical line. The height is given by the brightness value from the camera. That’s how we plot the values. The other part in the code will be segmenting the graph in 7 parts and fading the colors from blue to red.
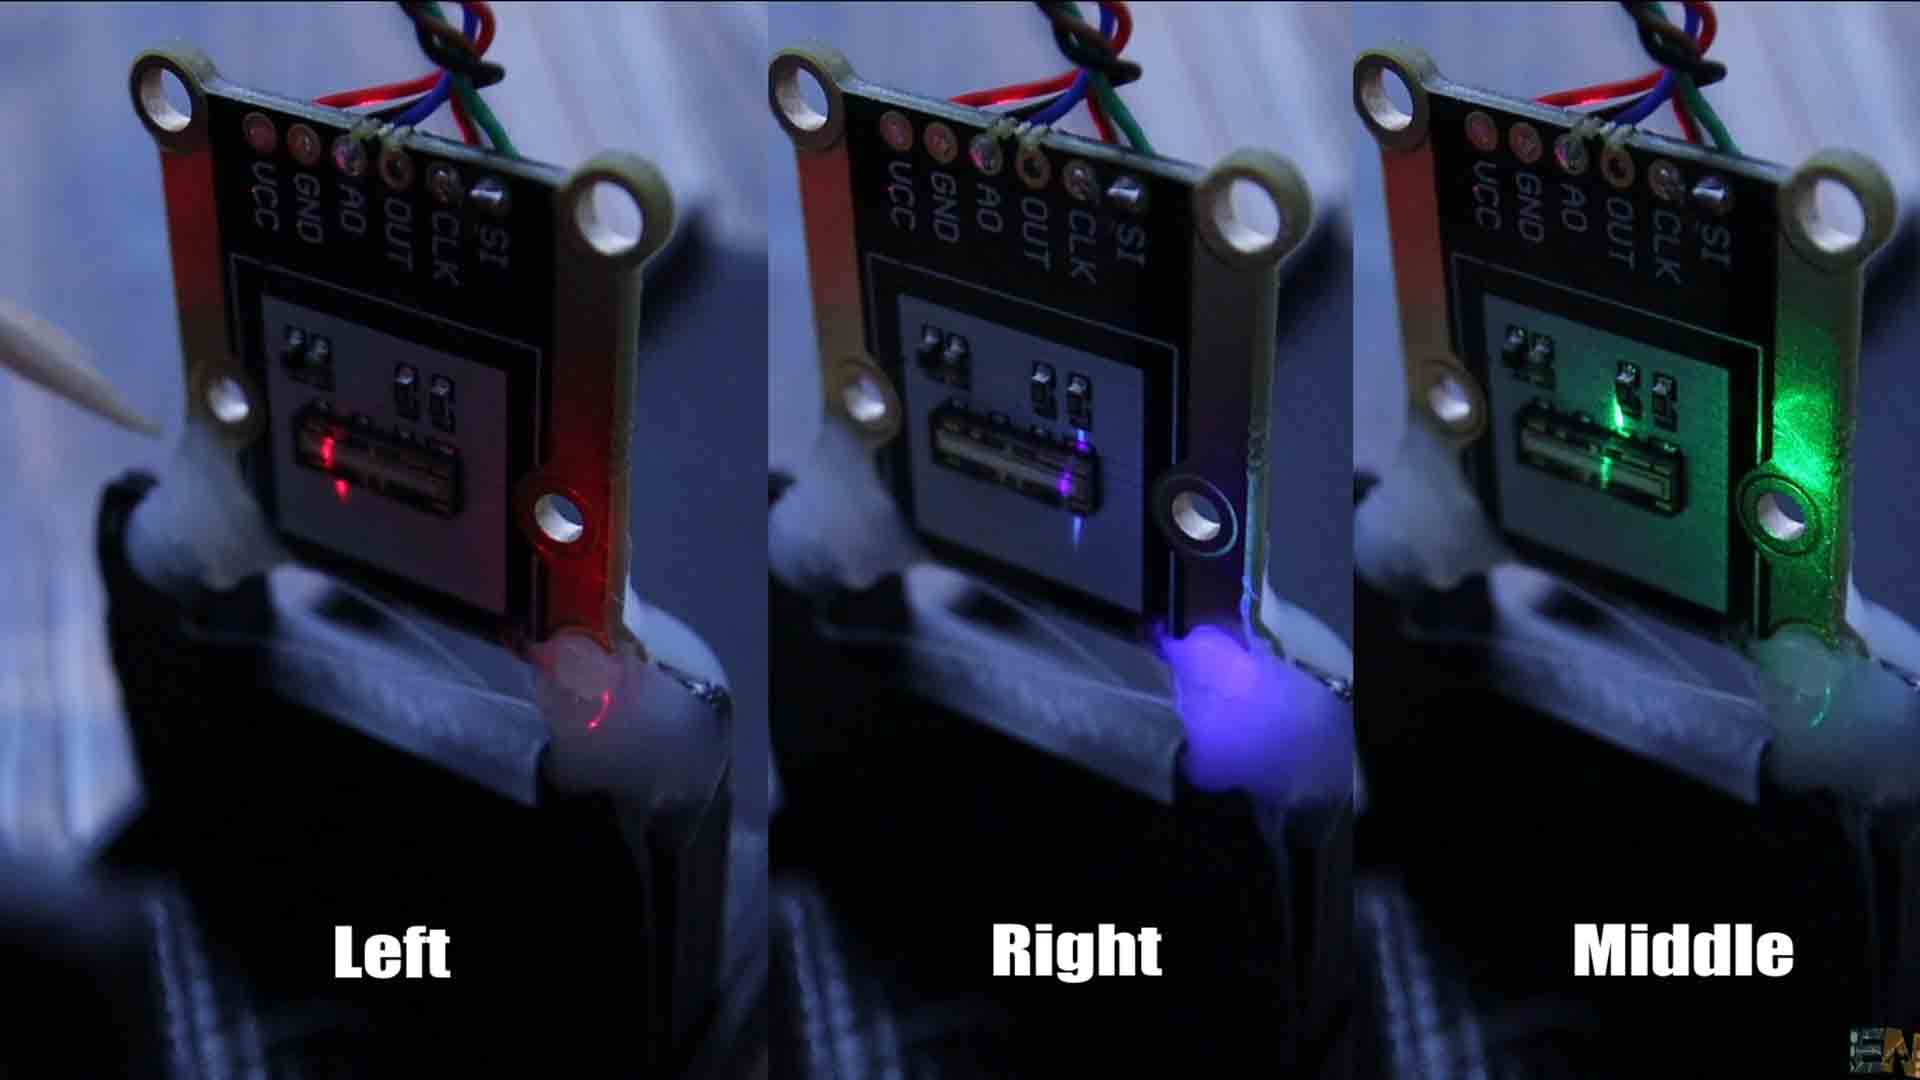
Ok, now we have the lens part, the diffraction process and we also measure the light with the camera. But how can we know the relation between the pixel position of the camera and the wavelength on the graph. So here’s what I will do. Point the red, green and blue lasers separately and you will see they hit a different position on the camera sensor. Then check the screen. For red, rotate the camera till we get the peak line at around 650 nm as it says on the laser pointer. Change the red laser to the blue one and the line will now be on the other end of the camera. If is not exactly at 405nm, you have to move the camera backwards or forwards in order to make the spectrum more narrow or wider as you can see. (Moving back and forth changest the spectrum width. Rotating the camera changes the wavelength position) Play around with moving the camera and rotating the entire slide till you get the colors at the correct wavelength on the screen.
Basically all is left to do is to place this inside a case but since this is just a prototype for now and I’m still testing around with different lenses, I’ll design the 3D case for a future update. Also, having a case will improve the results because no external light would get inside.
But I hope you now know how to make a crude homemade spectrometer. You should know more about how light travels and how each color has a different wavelength. Also how using a diffraction grating we can split the visible light into all its colors and then measure their intensity with a camera sensor.
If my videos help you, consider supporting my work on my PATREON or a donation on my PayPal. Thanks again and see you later guys.